All Activity
- Yesterday
-
Yep correct. Also CCR and the water ferries as they were quite large capacity rides/attractions.
-
I imagine that the capacity would have been reduced following the closure of the farm? That took out a lot of physical space for guests to be spread about. Even if a quarter of guests weren't using that area, it would certainly have helped with things in theory.
-
 Glitch reacted to a post in a topic:
Hyperia - New for 2024 (Ride thread)
Glitch reacted to a post in a topic:
Hyperia - New for 2024 (Ride thread)
- Last week
-
ImLucifer reacted to a post in a topic:
Fright Nights 2024 - Spoilers
-
owenstreet7 reacted to a post in a topic:
Slammer replacement?
-
The park do not need a planning application to remove it. However, if the park intend to use the space for a flat ride, it is better to leave it until they submit the planning application. This is because it makes it easier/quicker for the application to go through ("We have a ride here, we're replacing it with something of a similar size and scale"). If they remove the ride, turn it into a blank space, then put in an application, it's slightly more effort to put through (not to mention a general faff too). The park did say they'd look at removing it this closed season, but beyond that statement there's no indication either way whether that will happen. As you say though, there's no planning application in place as of yet, so it's unlikely we'll see a new ride in its space in 2025.
-
Hmm... I remember the park mentioning they're intending to remove Slammer this closed season however need planning permission to do so? I haven't seen any planning applications made so could this be delayed?
-
JoshC. reacted to an answer to a question:
Numbers of guests per day?
-
Just to add to this, back in the early to mid 2000's we were reaching numbers between 18000-20000. However this did cause issues. I particularly remember some of the days the queue to get into the car park went back towards the Sainsburys by Staines bridge. For comparison, EPCOT at Disneyworld gets around 80000-90000 for their New Years eve celebrations
-
JoshC. reacted to a post in a topic:
Fright Nights 2024 - Spoilers
-
JoshC. reacted to a post in a topic:
Hyperia - New for 2024 (Ride thread)
-
giga mack extreme spinner confirmed for 2027 then?
-
 skelly reacted to a post in a topic:
The Next Major Investment?
skelly reacted to a post in a topic:
The Next Major Investment?
-
Inferno reacted to a post in a topic:
Hyperia - New for 2024 (Ride thread)
-
Queue closed at 9.05 last night. Seems the information about early queue closure has now been removed from the app now too, so think its safe to say it'll close at 9 every night for Fright Nights. Hopefully that'll be the end of it and we won't see the return of the early queue closures next season
-
So after doing Fright Nights a few times now, I'll give my review. Dead Beat I did this for my first time yesterday. After seeing lots of mixed reviews I hadn't bothered with it before but kept it spoiler free for myself. But I was really pleasantly surprised with this, was my favorite maze last night by far. Its long, themeing is great, great smells, loved the soundtrack, lots of great scares (actors had some really good hiding places.) The ending with the actor flying above your head was my favorite part by far. That got me good, never seen something like that in a maze before. Survival Games Did this on the opening night and last night. On the opening night it was great, pretty much the same as last year. It was having a lot of issues that night though and saw the area got evaced at least 3 times due to the fire alarm going off. Yesterday however, it wasn't so great. Absolutely no smoke in the main area which made a huge difference. Potentially due to the fire alarm issues? But they really need to sort that out. What made this maze great was that you couldn't really see where you where going in the main part and it was confusing. With no smoke, you can see everywhere you're going. Actors seemed very hands-off yesterday too. Stiches Pretty much the same as last year. I don't know what it is but I feel like I've never had a particularly good run through in this maze. I want to enjoy it but its not for me and has never been one of my favorites unfortunately. Trailers Another one where I've never been the biggest fan off. This year does seem consistent though, good amount of actors and its a decent length. Just always felt this has lacked scares though. Bit cheeky calling them new scenes this year as not a lot has really changed. Crows Decent scarezone, pretty much an outdoor maze. Not as strong as last year though unfortunately. Lots of security/staff visible throughout the walk really kills the atmosphere too. On the first couple times I went they were constantly telling us to keep moving which was annoying, less of that yesterday but still does kill the atmosphere having them visible everywhere. Hopefully they can improve on this next year or have a change up as Crows are getting pretty stale now. Lucifers Lair and Creature Campus Can't really comment on either of these as I haven't really spent any time in either of them. Luciers Lair is decent and creates a nice atmosphere at the center of the park. I think its pretty cheeky calling Creature Campus a scarezone, its a dance show. I don't go to scare events to watch people dance to be honest, so not a bit of me. Not for me and I'd rather the budget was used for a different scare attraction instead, but I do understand the reasons for keep bringing it back as it does seem to be popular. Everything else Fright Nights will never be as good as it was in its old days, but overall its another strong year for Fright Nights. Yesterday in particular was great, got 3 mazes done in less than an hour. Operations across the park were great and didn't see a single breakdown or ride shutdown all day. Park wide audio I'm really not a fan of this year. Disappointing they haven't bothered with individual ride audio again too. Was always one of my favorite things about Fright Nights. Lighting looks great though this year, great to see so much permanent lighting. Best the park has ever looked at night. Theres still improvements that could be made though. Detonator for example had programmed lighting not long ago which seems to have disappeared. Would like to have seen them do more with Hyperia too. Imagine if the lights flashed as it went down the lift hill? Or flashed a different color even? There used to be a lot more smoke machines around the park as well which was cool, so would be nice to be see them return, especially with the new lighting. Vortex is looking great with a smoke machine, but other rides would benefit from this too. Samurai was always a good one. Stealths hasn't worked the last few times I've been which is a shame. Oh and lastly, I'll keep saying this every year. But 10pm closes are missed as there isn't enough time in the dark. Even if it means doing 11-10 or 12-11. Or as Josh has said before, even keeping the mazes and coasters open till 10 would be good.
-
Appreciate it thankyou for the insight.
-
So the ghost train is now being used for indoor train track fishing. Looks more fun than the attraction tbh.
-
I noticed last night Colossus is the only coaster with a Fright Nights soundtrack in the station. It’s very Vampire sounding like Chessington. I don’t really get it but it’s a thing……. I agree with the above, realistically if you’re going to have scare zones. You need to add more zones or convert Creature Campus and Lucifiers Lair (I like the concept, so it could stay) to an actually scary zone without having to speak to them and rely on dialogue. The theming and types of creatures in a scare zone should mean every time you walk through the area you get scared. Thorpe probably lack the theming in their scare zones at the moment. The existing two can stay but I know they have issues with hiring actors
-
jimbeam4 reacted to a post in a topic:
The Next Major Investment?
-
it starts like huur, huur, then it grows like HUUUR, HUUUUR, then it won't like HHHHHUUUUUUUUURRRRRRRRRRR, HHHHHHHHUUUUUUURRRRRRRRRRRRRR then you all think oh wow, this is going to be really quite something then in the next stage it goes whooosh, whistle whistle, do dur do dur dooo, dur dooooooooooooooooo, r, oh that's what happened, and then you're like oh dear, oh dear oh dear, oh oh oh oh dear dear dear dear dear dear dear dear dear
-
JohnnyRocket reacted to a post in a topic:
Sparkle Project
-
let's all meet up in the year 2000, won't it be strange when we're all fully grown, be there, 11 o'clock, by that fountain, near the skyride
-
something will surf you to dizzying heights, if we can afford the charge ding dong, ding dong, ding dong, ding dong something kinda spin, something else by them, them, all the depth is gone, creaking on and on, on
-
Seemingly reopened today. So yeah, not that bad. Funny though.
-
I know it sucks, but really is it that bad? It’s just a bit of the facade over the door that’s been bent and come off. 🤷♂️ Hopefully it’s a quick fix to that wire that been broken and that’ll be it done.
- Earlier
-
Well this isn’t good… 😳
-
Imagine being invited to a content creator programme and then slating it because they didn’t allow you to film the ride therefore impacting your content schedule and monetisation plan by spoiling the ride. Entitlement at its finest from TPWW. How is getting previews and freebies including unlimited fast track very one sided towards the park. I hope they get taken off the programme and a smaller channel invited.
-
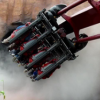
Getting caught between the external shell and internal seat mechanism. Bit of something breaks loose after suddenly moving for first time consistently all year and right in the way. Incident many years ago (think Japan) where a person got caught between the 2. Didn't end well.
-
Speaking goon to guest assistant this year with Lego. Madhouses in general are problematic. When they run, they run fab but when they go wrong it’s expensive. Like a Volkswagen Golf, the older model the less likely parts will be around for the older ones. If it counts, most of all of it is the same. Love to Mr Carson always
-
Had a few more runs of each maze. 2 on Survival Games and Stitches, one on Trailers and Dead Beat. Pretty similar to last week, although had one good and one excellent run through on Survival Games. Had one good run through on Stitches, but the other three I've done this year haven't been great. Trailers has delivered every time and I really liked Dead Beat last night. On the whole, though, yesterday was not good. Not sure I've ever seen the place as busy and didn't get to go on Hyperia this time, had to bail after all the shenanigans at the end of the day. Managed to catch a bit of Creature Campus, it's really not for me, we got bored fairly quickly and left. Some very "interesting" song choices. Enjoy Lucifer's Lair though, that should stay for as long as possible. Definitely in favour of Mawkin going now, it's had it's time and everyone I've done FN with this year or have spoken to about it has felt the same way, including some first time visitors. No sign of ride audio and I don't think it's coming unfortunately. Don't know if I'll be back until the last 2 weeks or so, but plan on 2+ more visits. I think Fright Nights is in a bit of a weird place right now, with mostly good mazes across the board that each offer something different (Stitches utterly terrifies some people even if it's not for all of us), but the free attractions and scare zones are lacking a bit this year. I'm not sure a new maze is necessary next year, and I still think all four mazes have a bit more left in them. I certainly don't want to lose Trailers or Survival Games just yet. Free attractions need a bit of a revamp next year. Lucifer's Lair can stay but I'd like two proper Mawkin-esque scare zones with new themes please.
-
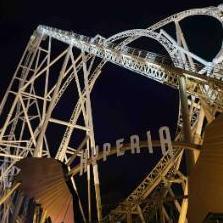
I know lighting wasn’t really made a big deal of from the park during the sparkle project but now it’s fright nights it’s the first real chance to see all the lighting installed and it’s really pretty impressive. To start with it simply for the most part looks really good - most of the rides have color coordinated lights, what’s also nice is the new lighting seems to be able to do various effects such as around inferno the lights do some sort of flame effects shining onto the ride. On that point I believe this is one of the first times the parks actually lit up the rides too, of course Stealth and colossus have had lighting before but other than that most of the lighting was more there to light up just the paths, now themed lighting is directing up to the ride structures them selves which look great. Finally not only looks good but there’s been some decent thought into how they work too - Vortex for example the lights are all white to start when loading, then when the ride cycle starts the lights all change to their “themed” status, also noticed when leaving at around 10:30 all the lights around the park lighting up the paths had changed to a standard white light, small things but nice to see some real thought has gone into how it all works, it’s clearly been a big investment and does make a difference!
-
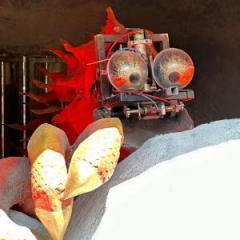
But why is the themeing on the cylinder being bent and broken… that doesn’t make sense!
-
I mean, that is true to an extent. But one could argue Hex has had a lot of more one and offs in the last eight years. Including the whole of 2016 on top of the whole of the last two years really. I have no information regarding the Asterix madhouse, but it is a pity if that too has been closed as that leaves the place without a sufficient indoor attraction at present. Following Transdemonium’s removal years ago.
-
You mean like the also been closed all season Defi de Cesar at Asterix? Hex isn't the only one that's been struggling.


.thumb.png.ae62487961fbf986a4aaa917b0aa3016.png)